
Project Overview
Revia.cl sells AI built into traffic infrastructure — but its dashboard let users resize every widget freely, producing a different broken layout each time. In a seven-business-day sprint coordinated directly with the CTO, I reframed the entire screen as a grid of fixed-size widgets: predictable for users, and a finite, buildable component set for engineering. The CTO confirmed it resolved the development pain point the engagement set out to fix.
Revia.cl is a Chilean B2B platform that pairs traffic cameras with AI. Operators — municipalities and infrastructure companies — use it to monitor vehicle flow, register license plates, and query historical records in real time from a web app. The intelligence is the product's own selling point: Revia sells AI built into the traffic sector.
I was brought in by referral to define the UI/UX of that web app while it was still in early development. The brief was narrow and concrete: take the product's essence and its existing front-end pieces and resolve them into one coherent, low-friction interface. The work ran as a seven-business-day sprint, coordinated directly with the CTO, who is also the lead developer.
This entry documents the proposal as delivered: a guidelines document plus the Figma source. It was a design handoff rather than an implementation, so what follows is the reasoning and the system itself, not shipped-product metrics.
The Starting Point: A Canvas Without Rules
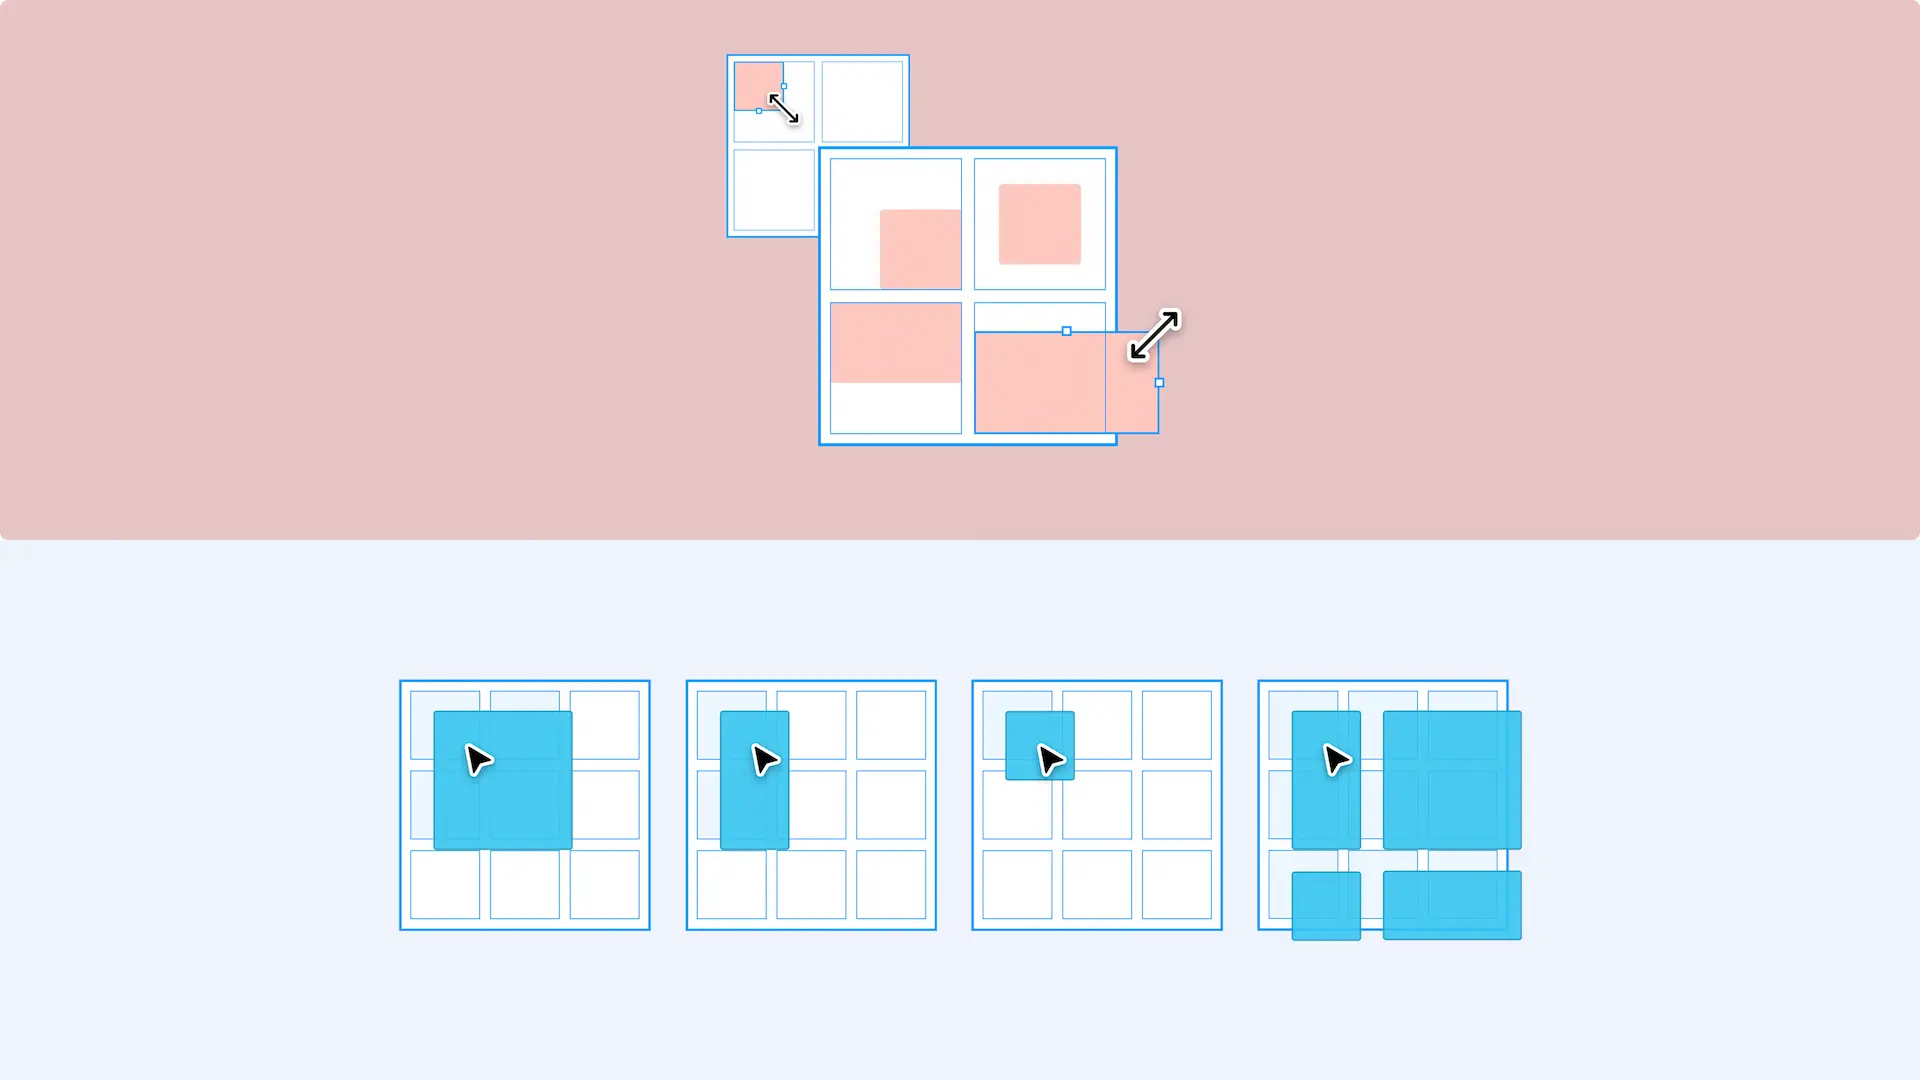
The core challenge was never purely aesthetic; it was structural. In the version I inherited, the dashboard let users drop data widgets, camera feeds, and record tables onto a free canvas and resize each one however they dragged it. Any component could take on arbitrary proportions.
That freedom read as flexibility but behaved as chaos. Components could stretch without limit and collide with the edges of the space meant to contain them, overlapping, misaligning, and producing a layout that looked different every time. The CTO had already flagged this as a concrete development pain point: an interface with no predictable structure is expensive to build against and almost impossible to keep consistent.
The real question underneath the visuals was simple: how should components actually be used on screen, with the least possible friction for the user and the least possible ambiguity for the engineer building them?
The Design Decision: Components as Widgets on a Grid
The solution was to stop treating the screen as a free canvas and start treating it as a grid, the same mental model mobile launchers use to organize home-screen widgets.
Every component becomes a widget with a fixed, delimited set of sizes. Instead of dragging a component to any arbitrary dimension, the user places it into defined slots, and each size snaps to a footprint the grid already understands. This single decision does double duty:
- For the user: predictable, legible layouts that cannot break, and an arrangement that feels like building rather than fighting the screen.
- For the engineer: a finite, enumerable set of component sizes to implement, which was exactly what the CTO needed to make development tractable.
The Grid
The grid itself is deliberately simple. It starts as a 3×3 canvas where components live and adapt to their assigned size. As the workspace fills, the canvas expands downward while holding a constant three-block width: the layout grows vertically and stays scannable, and never sprawls sideways back into the unpredictability the grid was built to remove.
Layout: Two Sidebars and a Workspace
With the grid as the foundation, I gave the app a clearly defined shell built from two sidebars around a central workspace:
- Left — Navigation. A retractable sidebar for moving through the app: search, settings, Templates, and saved Spaces.
- Center — The Workspace. The grid, always visible, where the user builds and edits their dashboard.
- Right — Interaction. A context panel for editing whatever component is selected, and the home of the AI assistant.
The split is intentional: navigation and structure on one side, component-level interaction on the other, with the canvas they both act on always in view.
Navigation Sidebar
The left sidebar keeps wayfinding light and adaptable. Templates are the preliminary Workspaces Revia ships: selecting one opens a new Space pre-named after that template, such as Plates, Records, or Photo-Radar. My Spaces holds the user's own saved Workspaces. The whole structure is built to flex if the product's sitemap changes, and to make creating and managing Workspaces intuitive through templates and autosave, with frequent actions surfaced as keyboard shortcuts.
Interaction Sidebar
The right sidebar is the user's main companion while editing a Workspace. It is deliberately dynamic, changing its contents with the selected component, and it is organized into predictable groups:
- Properties — the variable traits of a component, such as size and view type for a dashboard.
- Data — which database or camera the component is bound to, switchable from a dropdown.
- Filters — how the component's data is filtered: plate, records, count, first detection, last detection.
When no component is selected, the panel falls back to a component picker — Data, Records, Count — that the user drags onto the grid. When a Space has no database connected yet, the panel prompts to connect one before anything can run.
The AI Assistant as an Interface Surface
Revia's AI is a product feature: the company sells intelligence built into traffic infrastructure. My role was not to build that intelligence but to give it a place to live in the interface. I positioned the assistant at the base of the interaction sidebar, always within reach and always scoped to the component currently selected. Natural-language prompts — "add this week's plates," "show the record timestamps," "change the time format" — act directly on the component in focus, so the assistant reads as a precise editing tool rather than a detached chatbot.
The Component System
On top of the grid, each component type gets explicit sizing rules so it stays coherent no matter how a user arranges the workspace:
- Camera — stays strictly square to preserve the video aspect ratio: a single block (1×1) or a 2×2 square.
- Records — the most data-heavy component, so it earns more room: a vertical footprint by default (one block wide), up to two blocks wide and two or more blocks tall.
- Count — a single metric, kept to one 1×1 block so it stays simple beside heavier components.
These rules are not decoration; they are the contract that lets the grid guarantee a clean layout while still giving each data type the space it actually needs.
Putting It Together
To show the system working as a whole rather than as isolated parts, I assembled full sample views: a mock of the final product. They demonstrate a populated workspace — live camera feeds, a vehicle-flow record table, and a count tile, all sharing one coherent grid, with the interaction sidebar editing a selected component.
Visual System
The visual language stays sober on purpose. I drew the most restrained, minimal expression of Revia's existing brand — a palette built on a primary blue (#008DEC) and a deep neutral (#00416D), supported by lighter blue and neutral tones — to project the professionalism and reliability a B2B operator expects from monitoring software.
Type is set in Inter: highly legible, neutral, and trivial to implement on the development side, a practical choice for the product's first complete UI iteration. The whole system was specified to be friendly to the eye and friendly to the engineer building it.
Outcome & Scope
The deliverable was a UI/UX guidelines document and the accompanying Figma source: a paid design proposal, handed off and signed off, which closed the engagement. It was not implemented; Revia continues to run in production on its existing interface.
The one verifiable result comes straight from the client. The CTO confirmed that the grid system resolved the development pain point he had identified — the unpredictable, free-resize layout that made the interface costly to build against. Reframing every component as a fixed-size widget on a predictable grid gave the engineering side a finite, buildable structure, which was the core problem the engagement set out to solve.
What this demonstrates: turning a vague structural UX problem into a system engineering can build against — reasoning about layout as a contract between user and developer, and delivering it as a signed-off handoff under a tight, CTO-facing sprint.